Businesses often focus on dashboards, KPIs, forecasts, and executive summaries, but each of those outputs depends on something less glamorous and more important: the quality of the data preparation process.
In real business environments, data rarely arrives clean. It usually contains missing values, duplicate records, inconsistent categories, mixed date formats, numeric values stored as text, abnormal observations, repeated columns, blank rows, or fields that should never be automatically modified. If such issues are not handled carefully, even the best analysis will produce misleading conclusions.
This is why Brill-Viz Smart Auto-Clean was designed as more than a cleaning button. It is a controlled, explainable, report-backed data preparation workflow. Its purpose is not simply to change the data. Its purpose is to help users understand what was found, what was fixed, what was preserved, what was flagged, and what still deserves review.
A major selling feature is that missing-value handling is not left to repeated manual guesses or one blanket fill rule across every column.
The key idea is simple: cleaning is useful only when users can trust, review, and report what happened.
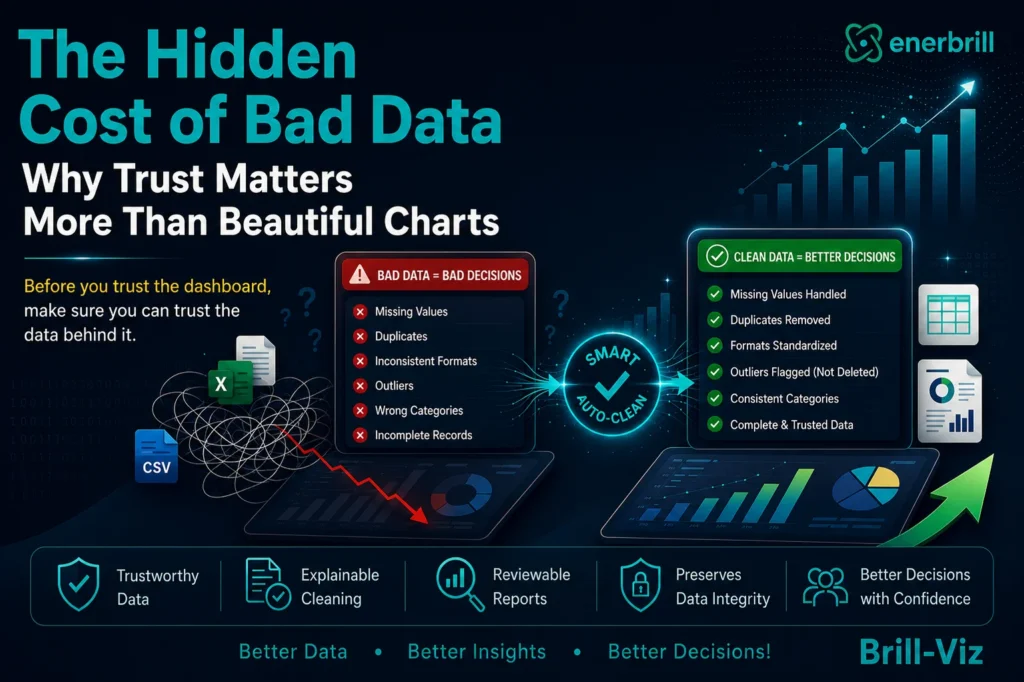
What Is the Hidden Cost of Bad Data?
Most organizations don't lose money because their dashboards are unattractive; they may lose if the numbers behind those dashboards quietly become less trustworthy over time.
The danger is that bad data rarely announces itself. It hides inside everyday business operations, gradually influencing reports, forecasts, budgets, and strategic decisions without raising obvious alarms.
A duplicated customer record may overstate sales. An incorrectly parsed date may shift monthly trends and lead managers to believe demand is rising when it is actually falling.
Missing inventory values may trigger unnecessary purchases—or worse, prevent critical stock from being replenished.
Inconsistent product names can split one product into several categories, making top-selling products appear average.
A few incorrectly handled missing values may change profitability calculations, forecasting models, or customer segmentation enough to influence million-dollar decisions.
The dashboard still looks professional. The charts still look convincing. The KPIs still appear precise.
But the conclusions may already be wrong.
That is the hidden cost of bad data, not software failure. It is a business decision made with incomplete, inconsistent, or unintentionally distorted information.
In highly competitive industries, even a small analytical error can result in excess inventory, missed sales opportunities, poor resource allocation, incorrect budgeting, regulatory issues, dissatisfied customers, or expensive strategic mistakes.
These costs are often invisible because nobody questions the charts. Instead, they trust the data behind them.
Unfortunately, trust is exactly what poor data quietly erodes.
The Real Problem Isn't Visualization
Most organizations already possess excellent visualization software. The challenge usually begins much earlier. Decision makers first need confidence that the underlying data is suitable for analysis. Before meaningful analytics can begin, every dataset deserves careful evaluation:
These questions form the foundation of trustworthy analytics.
Brill-Viz evaluates data quality before moving into statistical analysis and visualization because better decisions begin with better data.
Why Data Cleaning Is a Decision-Intelligence Problem
Data cleaning is often treated as a technical step, but in business analytics it is a decision-risk step.
If missing values are filled incorrectly, totals may change. If outliers are removed blindly, genuine business events may disappear. If duplicate columns are removed without understanding their meaning, important business fields may be lost. If dates are parsed incorrectly, trends and forecasts may shift.
If categories are inconsistently written, product, region, customer, or branch comparisons may become unreliable.
This means that data preparation directly affects management interpretation. The quality of a chart, forecast, comparison, or executive snapshot depends on what happened before the analysis began.
Reliable data cleaning improves the accuracy, completeness, consistency and usability of information before analysis. IBM’s guide to data cleaning explains that the process addresses problems such as missing values, duplicate records, inconsistent formats and structural errors, helping organizations produce more dependable analysis and decisions.
Brill-Viz Smart Auto-Clean addresses this by making cleaning controlled, conservative where needed, transparent, and reportable. It does not treat all data issues the same way. It distinguishes between values that can be safely standardized, values that should be imputed with care, values that should only be flagged, and columns that should be protected from automatic modification.
Smart Auto-Clean Is Not Blind Automation
A major weakness of many automated cleaning workflows is that they silently modify the dataset. The user may see a clean output, but may not know what changed. That creates risk.
Smart Auto-Clean follows a different philosophy. It is built around safe missing-value control and outlier flagging. The method includes user-controllable cleaning modes, missingness diagnosis, group-wise and time-aware imputation, protected-column support, exact outlier drill-down, domain plausibility rules, confidence labels, rollback metadata, and explainable reporting for every cleaned column.
This makes Smart Auto-Clean suitable for users who need to explain their work, not just produce quick outputs.
The workflow is especially important for business settings where data may support pricing decisions, stock decisions, sales planning, supplier review, customer analysis, operational performance, forecasting, or management reporting.
Why Manual and Simple Bulk Filling Is Error-Prone?
In ordinary spreadsheet and BI workflows, users usually do not fill thousands of missing cells one by one. They first find missing values using filters, blank-cell selection, conditional formatting, or a missing-value summary. Then they typically apply a rule to a selected column or group of columns: fill down, replace blanks, use a fixed value, fill numeric gaps with a mean or median, or fill categories with the most frequent value.
That approach is fast, but prone to errors. A user may apply the wrong fill method to the wrong column, use one median where group-wise filling was needed, fill too many blanks in a column with high missingness, or accidentally treat identifiers, dates, categories, and numeric measures as if they were the same kind of data.
The problem is not that mean, median, mode, or fill-down methods are always wrong. They can be useful when chosen deliberately. The problem is that simple bulk filling often depends heavily on the user remembering where the blanks are, choosing the right rule for each column, and documenting every decision manually.
This makes missing-value cleaning a major source of hidden analytical risk. The dataset may look complete after cleaning, but the imputed values may have flattened variation, shifted relationships, or introduced assumptions that are not visible later.
What Makes Brill-Viz Auto Mode Different?
Brill-Viz Smart Auto-Clean treats Auto missing-value handling as a context-aware decision, not as a single blanket command. When Auto is selected, the system diagnoses the missingness pattern before choosing a method. It considers column type, missing percentage, whether the gaps are scattered or block-based, whether useful group columns exist, whether a time column is available, and whether the selected method may distort the statistical shape of the data.
This creates several distinct selling features:
This is why Brill-Viz is not positioned merely as a faster way to fill blanks. It is positioned as a safer, reviewable, and more defensible way to prepare data for business decisions.
Practical Examples: Where Auto Mode Avoids Common Filling Mistakes?
The value of Smart Auto-Clean becomes clearer when missing values are not concentrated in one neat column, but scattered across different business fields. In a 10,000-row dataset with 30 columns and 2,000 blanks, a spreadsheet user may be forced to decide column by column whether to use fill down, mean, median, mode, fixed value, or no fill at all. Brill-Viz Auto mode reduces that decision burden by looking for context before acting.
Example 1: Regional sales values
If Sales is missing for some branches or regions, a simple spreadsheet rule may fill every blank with the overall sales median. That can overstate small branches and understate large branches. Brill-Viz can prefer group-wise logic when suitable group columns exist, such as Region, Branch, Product, Customer Segment, Asset, or Channel. The result is not just a filled value; it is a more defensible fill method with a recorded reason.
Example 2: Monthly or daily trend data
If missing values occur inside a time sequence, a flat median may break the trend. Brill-Viz can use time-aware filling when a valid date or time column exists, so the gap is handled in relation to neighboring observations instead of being treated as an isolated blank.
Example 3: Category labels and carry-down fields
In many business files, labels such as Company, Region, Product Category, Field, Basin, Store, or Department may appear once and then leave blank rows below until the next label. A spreadsheet user may manually fill down, but may also overfill into the wrong block. Brill-Viz can recognize label-style columns and apply carry-down logic cautiously, while still reporting what it did.
Example 4: Identifier-like columns
A Customer ID, Invoice Number, SKU, Account Number, Transaction ID, or Well ID may look numeric, but it is not a numeric measure. A simple rule or careless AI-generated script may accidentally treat it as a number. Brill-Viz treats such fields as protected or sensitive where possible. These columns should not be averaged, normalized, or imputed like sales, quantity, or cost.
Example 5: High-missingness columns
If a column has too many missing values, filling it may create a false sense of completeness. Brill-Viz can leave high-risk missingness unresolved or flag it for review instead of pretending that every blank should be filled automatically. This is important because sometimes the safest cleaning decision is not to fill.
Example 6: Outliers and unusual business events
A sudden sales spike, stockout event, shut-in pressure reading, production jump, refund burst, or large one-time order may look statistically unusual. Brill-Viz flags these values and explains why they are unusual, but it does not silently cap, overwrite, or remove them in the safe Auto-Clean path. This protects the story hidden inside the data.
How Brill-Viz Builds Confidence Compared with Spreadsheet, BI, and AI Workflows?
Spreadsheet and BI tools can be fast and useful, especially when the user already knows the correct rule. AI tools can be flexible and conversational. The risk is that the cleaning logic may still depend on manual choices, hidden assumptions, prompt quality, generated code, or simple bulk transformations that are not packaged as a business-readable audit report.
Brill-Viz creates an edge by combining action with explanation. It does not only ask, “How do we fill this blank?” It asks a sequence of safer preparation questions:
This is the confidence advantage. The user does not only receive a cleaner sheet. The user receives a preparation record: method selected, reason, confidence, affected values, skipped items, outlier policy, protected columns, statistical impact, and audit trail. That makes Brill-Viz more than a cleaning shortcut. It becomes a defensible data-preparation workflow.
A practical selling phrase is: Brill-Viz does not just fill missing values. It reduces the risk of filling them wrongly.
Smart Auto-Clean Side by Side
The paragraphs above make the argument in words. The table below makes it concrete - the same six questions, answered by three different approaches to data preparation.
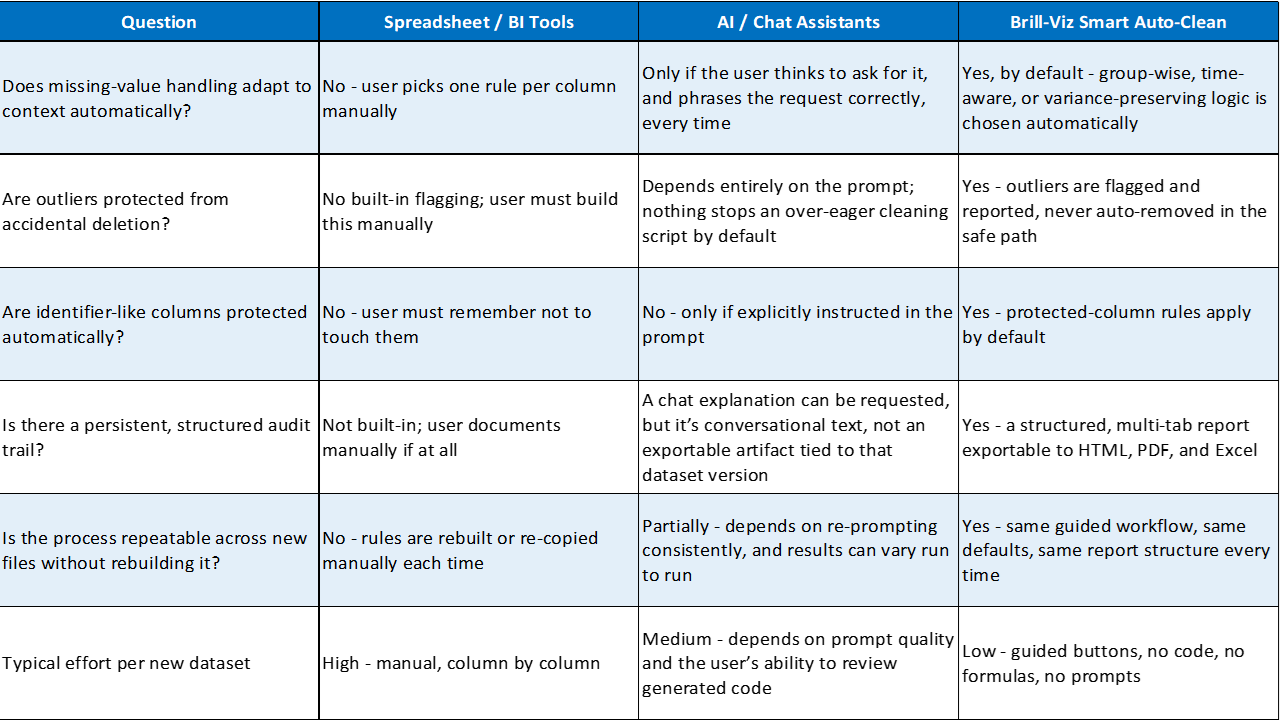
None of this downgrades spreadsheets or AI / Chat assistant tools - they remain excellent for flexible, one-off, conversational analysis, and a skilled user can absolutely replicate any single row of this table by hand. What Brill-Viz changes is that none of it has to be rebuilt, re-prompted, or remembered every time a new file lands on someone’s desk.
Stage 1 - Load Raw Data
Load and Diagnose the Dataset
The first stage begins when the user loads a dataset into Brill-Viz. Before cleaning starts, the system profiles the original data and captures a pre-clean summary.
This is important because the user needs a baseline. Without a baseline, there is no way to judge whether cleaning improved the dataset, distorted it, or left important issues unresolved.
The pre-clean diagnosis can include rows, columns, missing values, duplicate rows, empty rows, empty columns, duplicate columns, date issues, text irregularities, and outlier indicators.
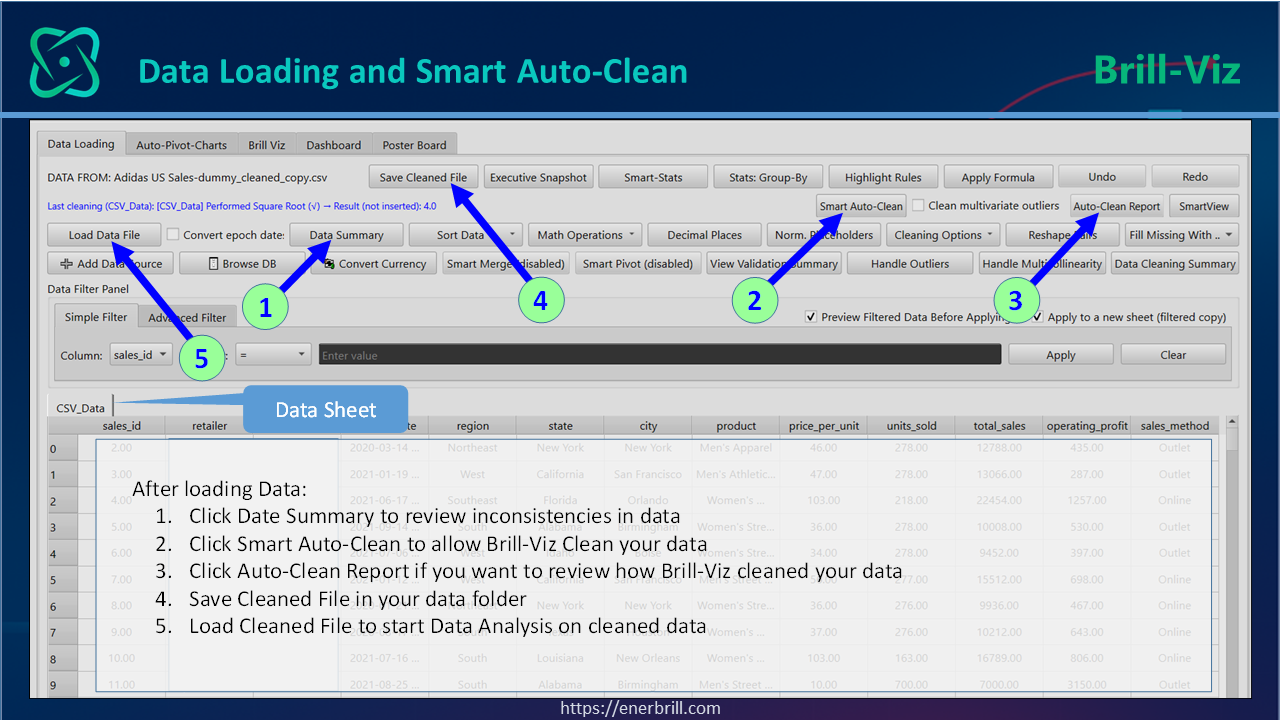
Figure 1: Smart Auto-Clean entry point in the Data Loading tab
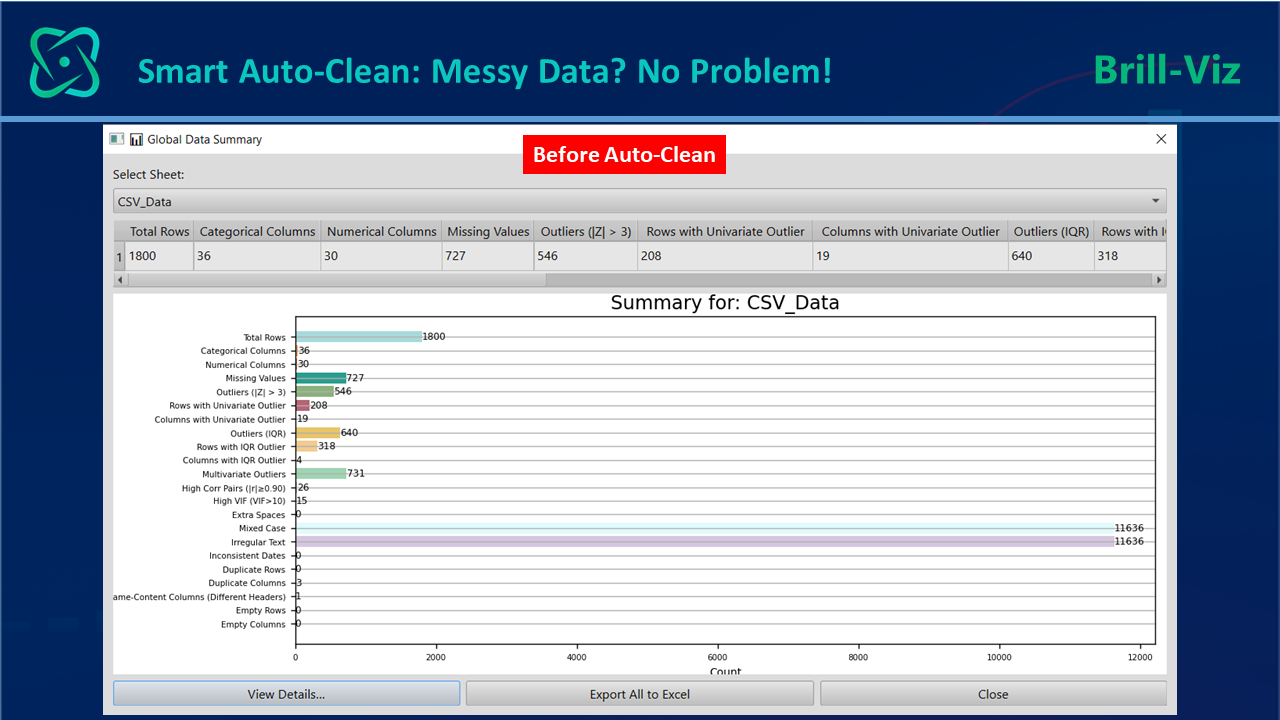
Figure 2: The original data summary before cleaning, including missing values, duplicate rows, date columns, inconsistent dates, text issues, and outlier counts.
Stage 2 - Detect Issues
The second visual stage in the cover picture is Detect Issues. In practice, this is the point where Smart Auto-Clean slows the user down in a productive way: before making changes, it helps diagnose the condition of the dataset and lets the user choose how strongly the cleaning should act.
Choose the Cleaning Mode
Smart Auto-Clean gives the user control before cleaning begins. Instead of forcing one fixed cleaning behavior, it supports cleaning modes such as Conservative, Balanced, Strong Missing Fill, and Custom. It also supports missing-value strategy options such as Auto, Leave Missing, Median, Mean, Group-wise, Time-series, and KNN.
Outlier handling is intentionally fixed as flag only - report, do not modify, which means Auto-Clean does not automatically cap, overwrite, or remove outlier rows in the main cleaning path.
This is a very important design decision. It protects users from accidental over-cleaning. For most business datasets, Balanced + Auto missing fill is a practical default. Conservative mode is safer for sensitive datasets. Strong Missing Fill may be useful where the user accepts more automated filling, but still wants reportable control.
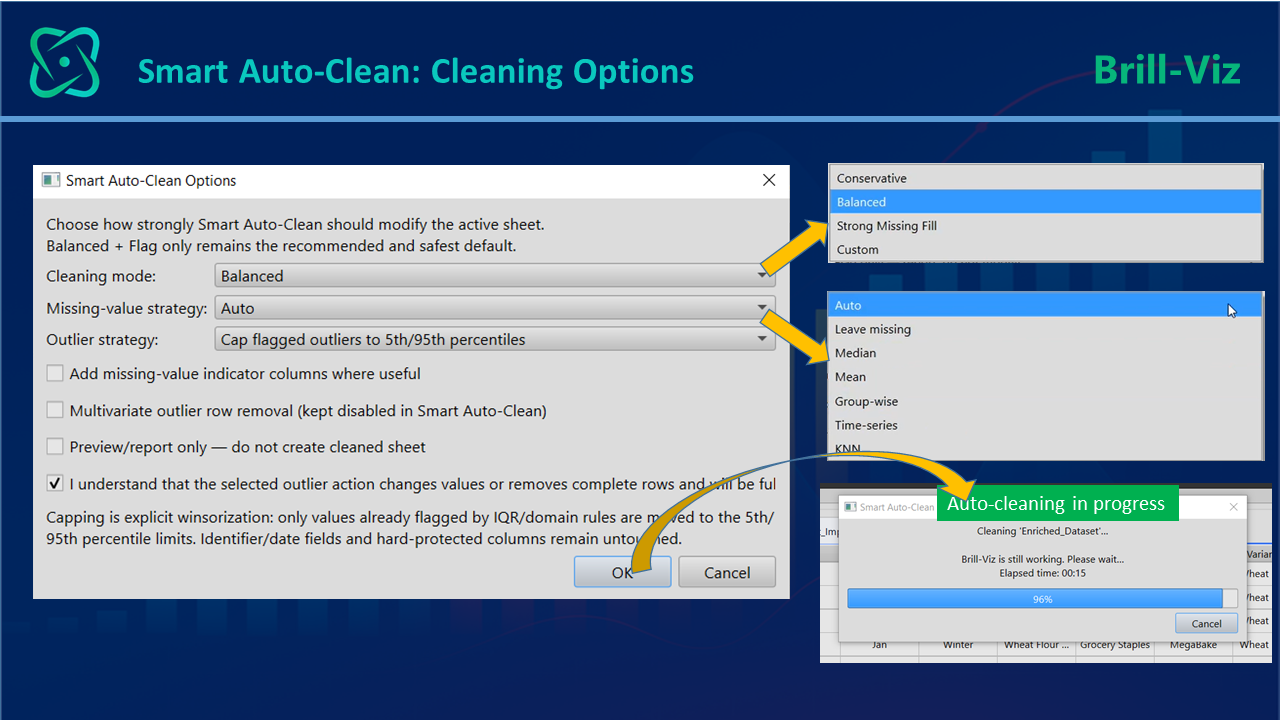
Figure 3: Smart Auto-Clean: Data cleaning options dialog showing cleaning mode, missing-value strategy, outlier strategy, missing-value indicators, and preview/report-only option.
Type your paragraph here
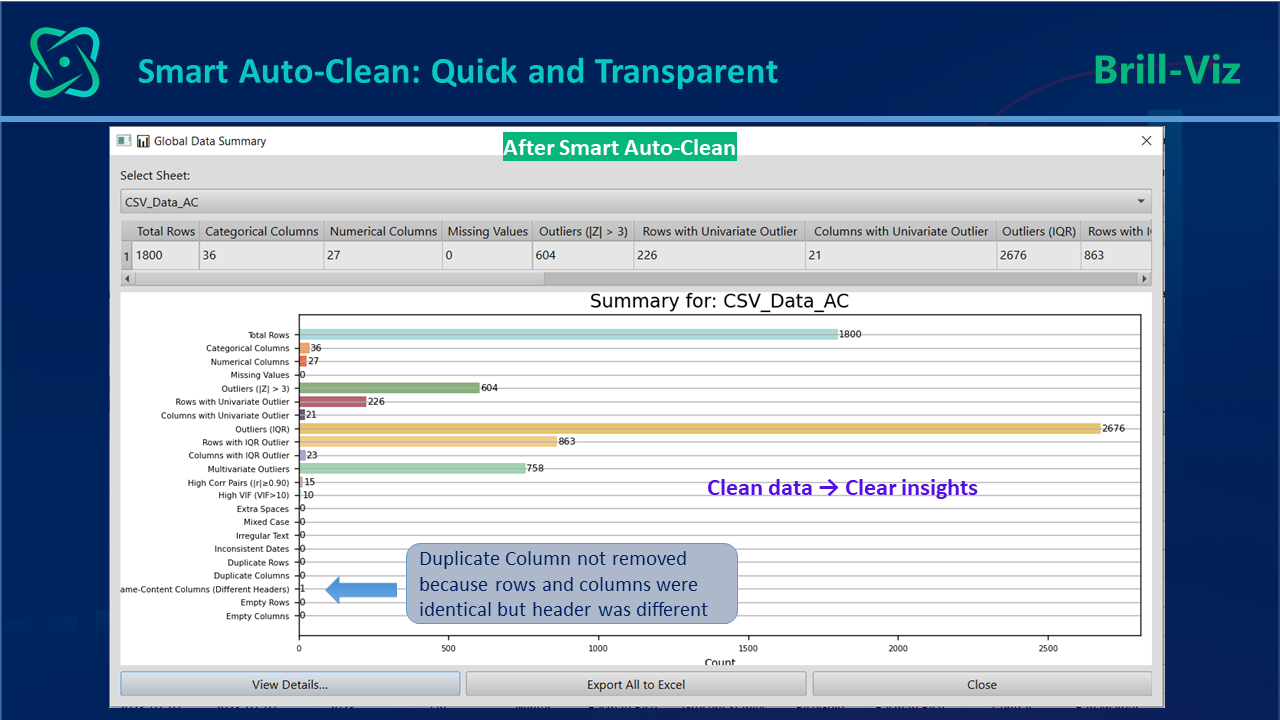
Figure 4: Post cleaning data summary, showing that missing values have been filled, duplicates remove and other features of the data also altered after the changes in the data.
Detect Missingness, Type Problems, Duplicates, and Outliers
At this stage, Smart Auto-Clean identifies the main issue classes that will shape the workflow: missingness patterns, numeric-like strings, date inconsistencies, text irregularities, duplicate rows, duplicate or review-only similar columns, and statistically unusual values. The purpose is not to treat every issue identically, but to detect them clearly before action is taken.
This detection stage is one reason the Brill-Viz workflow is more trustworthy than blind automation. It establishes what the software found before it starts filling, standardizing, or reporting.
Stage 3 - Smart Auto-Clean
Once the issue patterns are understood, Smart Auto-Clean applies controlled cleaning logic. This is the execution stage in the visual workflow, but it is still safety-first: missing values are handled carefully, structural inconsistencies are standardized where appropriate, and outliers are flagged rather than silently altered.
Clean Missing Values Safely
Missing values are one of the most common problems in business data. But missing values should not all be treated the same way.
Some missing values may be random. Some may occur in blocks. Some may be linked to a specific group, branch, region, product, or customer segment. Some may follow time patterns. Some may be too frequent to fill safely.
Smart Auto-Clean handles this by diagnosing missingness before filling values. In Auto mode, it does not simply stamp every missing numeric cell with one flat mean or median by default.
Depending on the data structure, it can use group-wise filling, time-aware interpolation, carry-down logic for label-style columns, safe categorical handling, variance-preserving numeric fallback, optional KNN-style imputation when explicitly selected or enabled, or leave missing values unchanged when filling would be risky.
This distinction is important for product positioning. Brill-Viz is not just replacing blanks. It is reducing the risk that users apply the same fill rule to very different columns without noticing the analytical consequences.
The methods also support missing-value indicator columns where useful. This is important because missingness itself may carry meaning. For example, a missing supplier value, missing sales channel, or missing customer segment may indicate a data capture issue that should not disappear silently.
Missing-value treatment should be planned, tested and documented rather than applied through one blanket rule. The U.S. Census Bureau’s editing and imputation standard recommends statistically sound methods, quality monitoring, identification of imputed values and retention of sufficient documentation to evaluate the process.
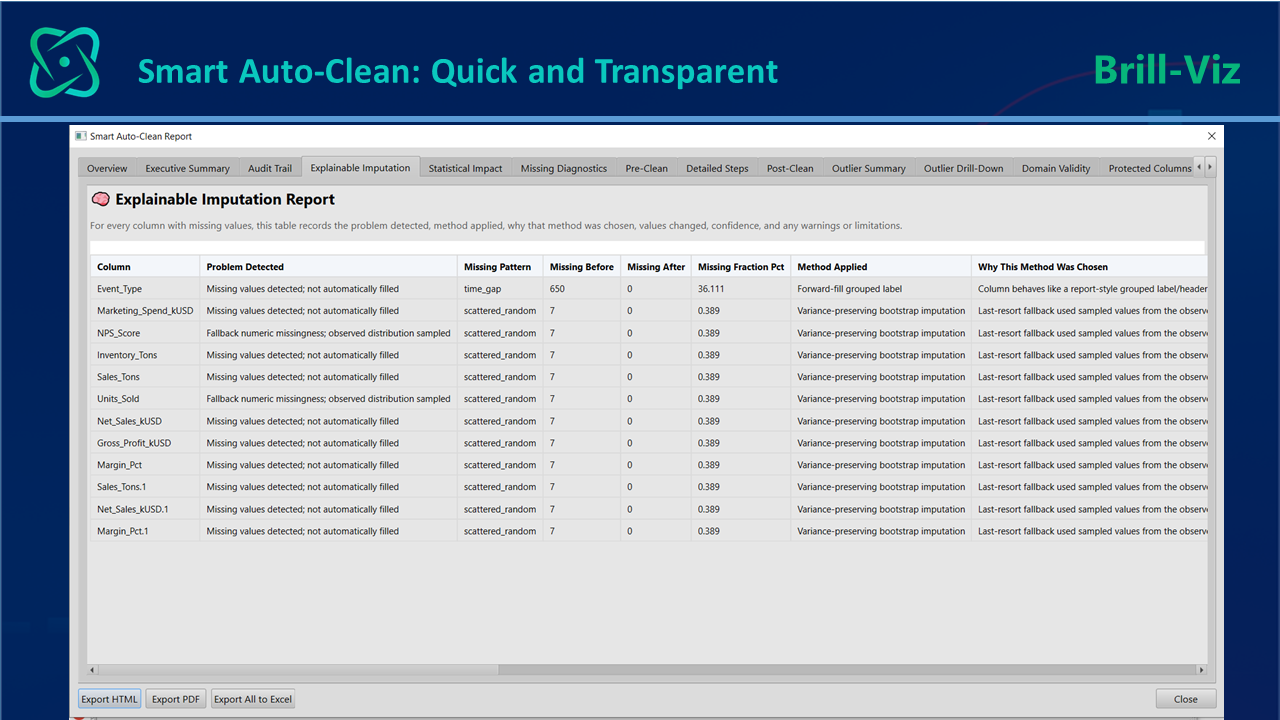
Figure 5: Explainable Imputation tab Show columns with missing values, method used, reason for method selection, filled count, confidence level, statistical impact and warning flags.
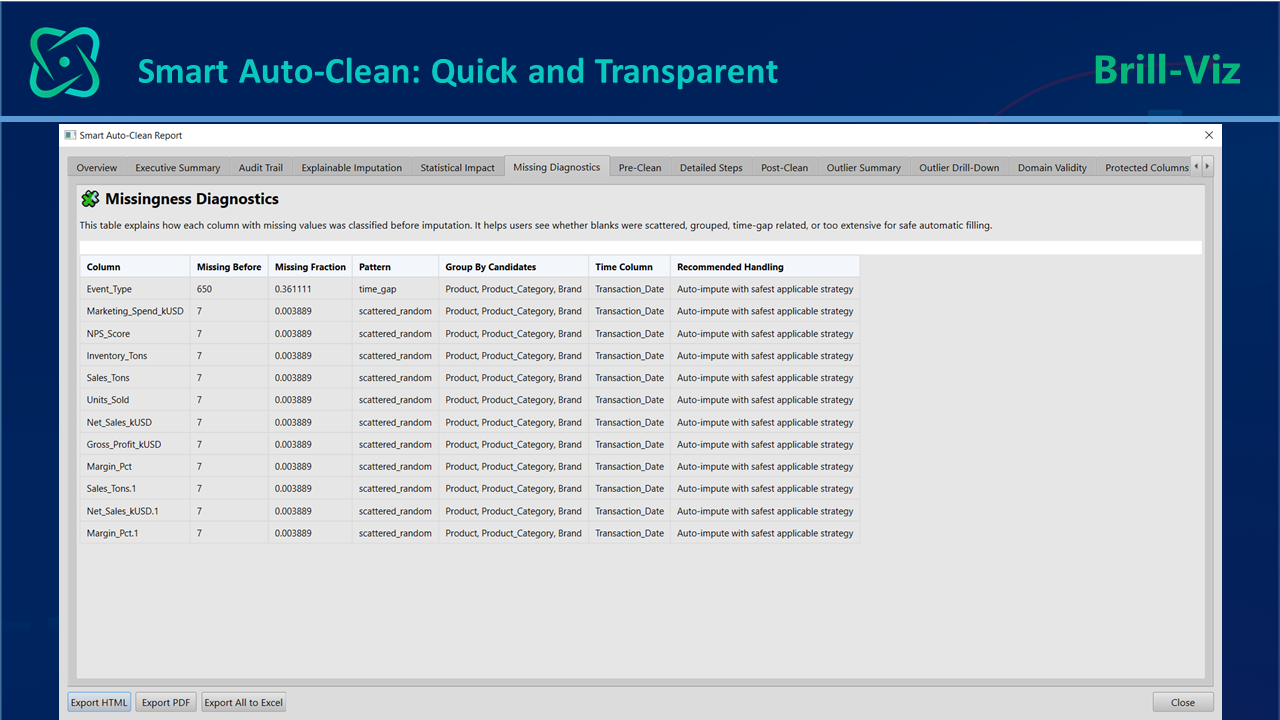
Figure 6: Missing Diagnostics tab showing whether missingness was scattered, grouped, time-related, block-based, or high enough to require caution.
Normalize Types, Dates, Text, and Duplicates
After missing-value diagnosis, Smart Auto-Clean also improves common structural problems. Numeric-like strings can be converted into numeric values when safe. Date-like values can be standardized. Excel serial dates can be converted into real dates where plausible. Text fields can be trimmed, repeated spaces collapsed, non-breaking spaces fixed, control characters removed, and case standardized cautiously.
This matters because analytical tools depend heavily on correct data types. A sales column stored as text may not summarize correctly. A date column stored inconsistently may not work properly in time-series analysis. A category field with extra spaces may split one product or region into multiple versions.
Duplicate handling is also conservative. Duplicate rows are removed only when the full row is exactly repeated. Duplicate columns are removed only when both the header/name and the contents are identical. Columns with different headers are preserved even if their values match, because they may represent different business meanings.
This avoids the common mistake of removing columns just because they look similar.
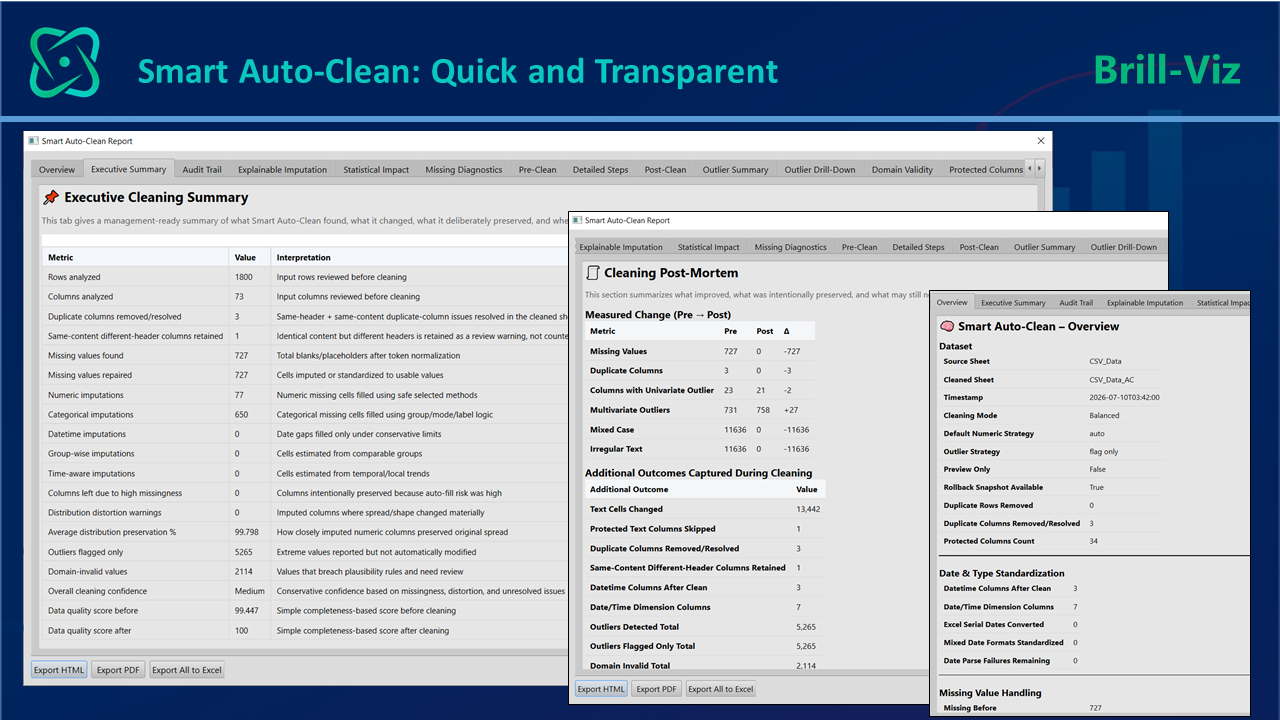
Figure 7: Executive Summary, Cleaning Post-Mortem and Smart Cleaning Overview tabs showing what has been done with the data.
Flag Outliers Instead of Silently Changing Them Or Cap Them Between 5% and 95%
Flag Outliers Instead of Silently Changing ThemOutliers are one of the most sensitive parts of automated cleaning.A very high sales value may represent a genuine bulk order. A sudden profit spike may reflect a real business event, while a low inventory value may signal a stockout. Automatically removing or altering such observations may make the dataset appear cleaner while weakening the analysis.
Smart Auto-Clean therefore follows a controlled policy. By default, outliers are detected, summarized, and reported without being modified or removed. Where treatment is appropriate, users may deliberately apply 5th/95th-percentile capping, which replaces values below P5 with the P5 value and values above P95 with the P95 value.
This limits the influence of extremes without deleting records, and the change remains visible in the cleaning report.
Outliers are initially identified using IQR-based lower and upper fences. Smart Auto-Clean also considers domain plausibility, distribution shape, semantic column class, protected-column rules, and confidence level before recommending action.
This is a major strength of the workflow: it separates detection from destruction while allowing controlled, transparent capping when justified.
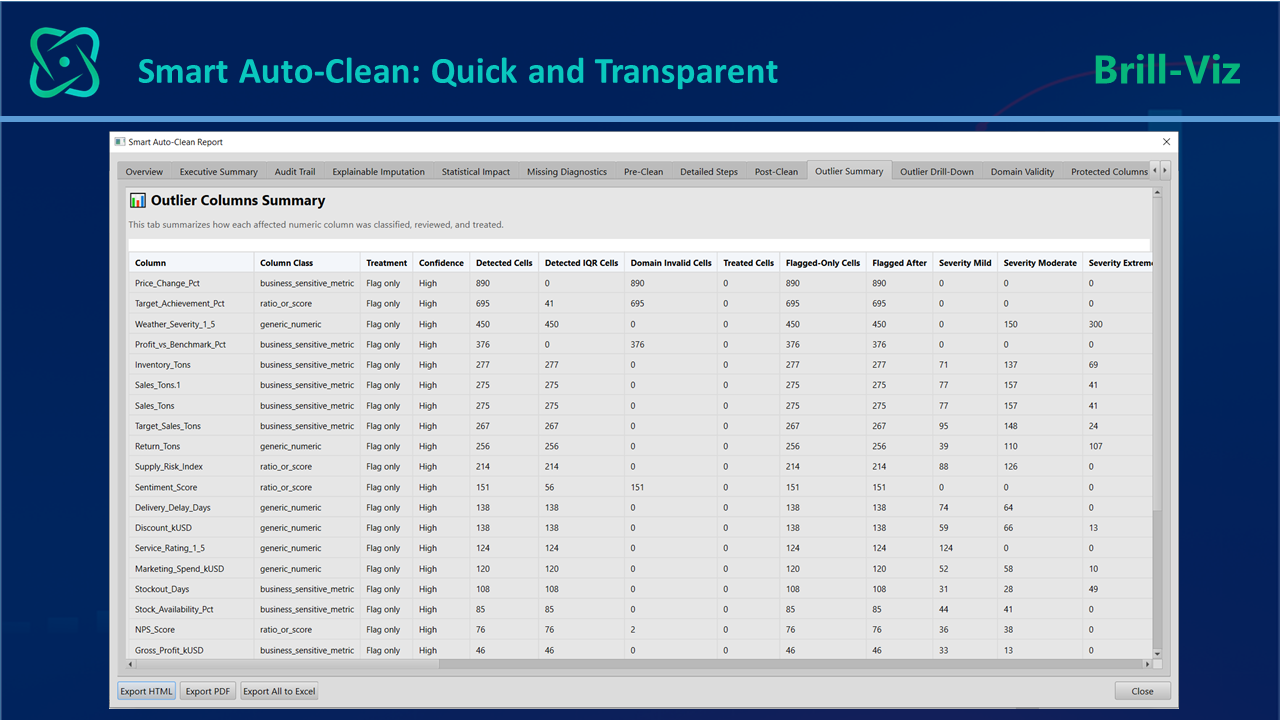
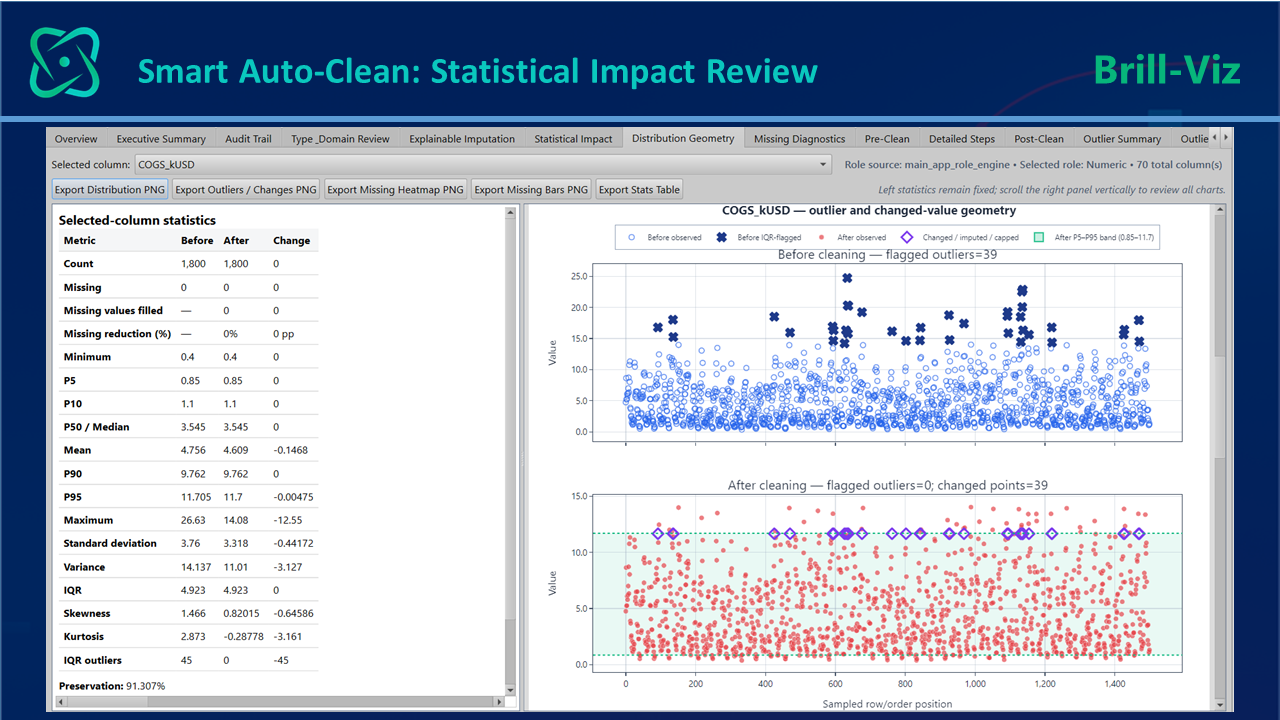
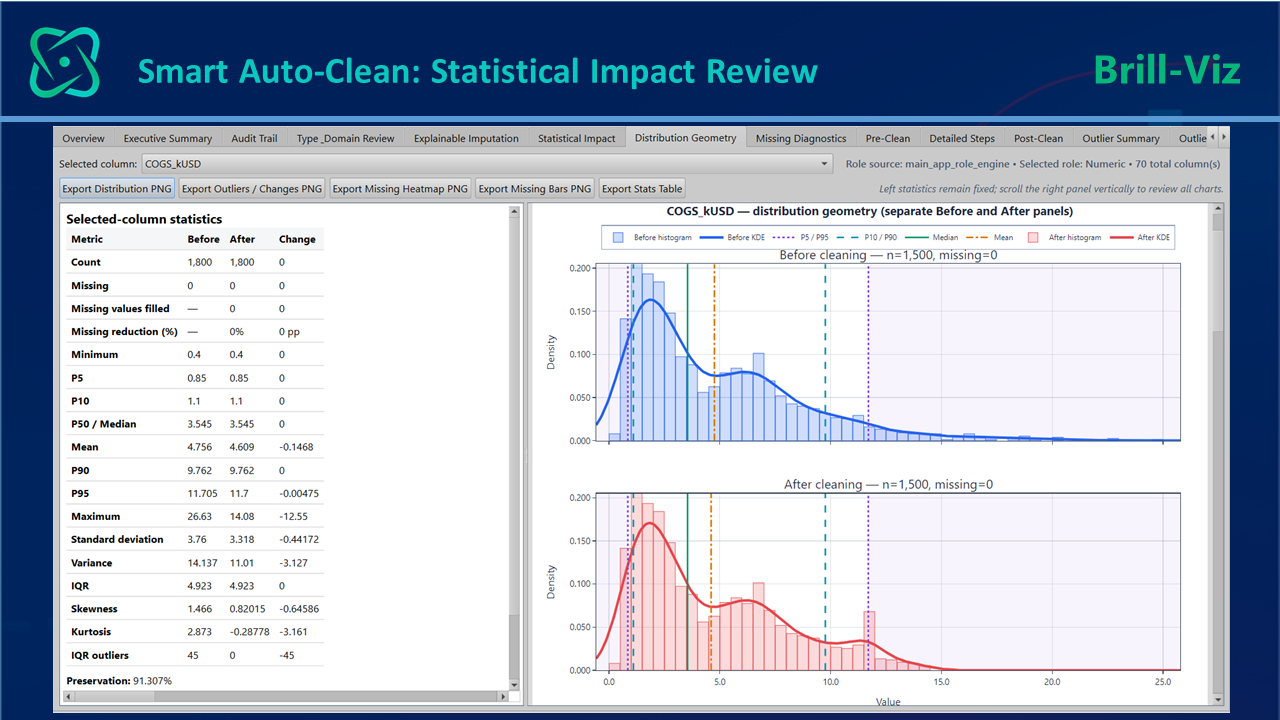
Figure 8 (a,, b, c): data cleaning report showing how outliers are handled, either flagged or capped at 5th/95th percentiles and the impact of cleaning on the original statistical geometry of the data. Outlier summary tab shows columns with outlier counts, low/high outlier counts, distribution shape, and recommended action.
Stage 4 - Review Auto-Clean Report
The fourth visual stage in the cover picture is Review Auto-Clean Report. This is where Smart Auto-Clean becomes especially defensible: users can move from “the data was cleaned” to “here is exactly what was found, changed, preserved, flagged, and measured.”
Review Domain Validity and Protected Columns
Not all data issues are statistical. Some are domain issues. For instance, negative values may be invalid for quantities, durations, counts, ages, or percentages. Percentages may be expected within 0–100. Probability or confidence fields may be expected within 0–1. Age-style fields may be expected within 0–120. These checks help identify values that may not simply be unusual, but plausibly invalid.
Smart Auto-Clean includes domain plausibility rules for such cases. It also supports protected-column rules such as never-cap, never-impute, never-normalize, and report-only.
This is especially important for identifiers, codes, invoice numbers, transaction IDs, SKUs, account numbers, financial fields, production metrics, or other sensitive business columns. Protected columns help prevent the software from “helpfully” changing something that should not be changed.
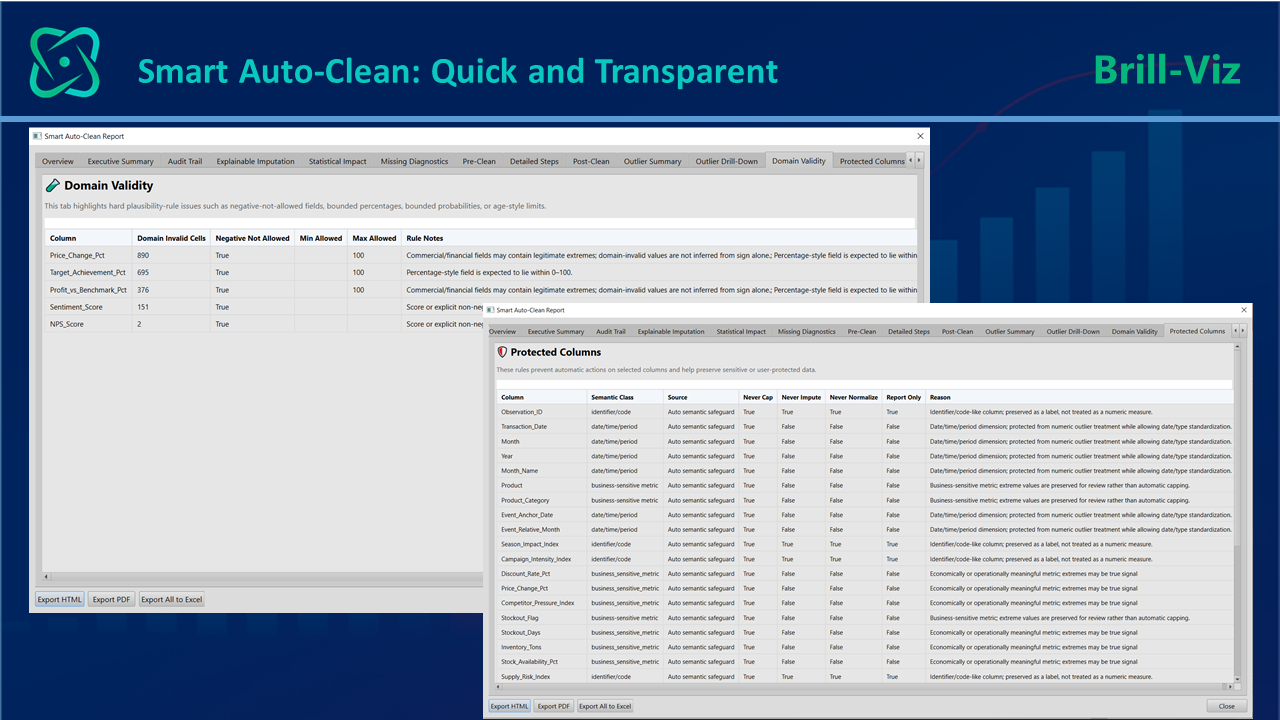
Figure 9: Domain Validity tab showing invalid values and rule notes and Protected Columns tab showing columns marked as never-cap, never-impute, never-normalize, or report-only.
Measure the Statistical Impact of Cleaning
A serious cleaning system should not only say what it changed. It should also show whether the cleaning materially affected the dataset.
Smart Auto-Clean includes statistical impact reporting. It can compare before-and-after measures such as mean, standard deviation, variance, skewness, variance ratio, distortion flags, and preservation scores. This is important because cleaning can accidentally distort the shape of the data.
For example, filling too many missing numeric values with the same median may flatten variation. Aggressive treatment can reduce variance too much. Poor imputation can shift the mean. If a cleaned dataset looks too smooth, conclusions may become misleading. The Statistical Impact tab helps users see whether cleaning preserved the analytical character of the data.
Preserve Data Geometry and Diagnostic Integrity
One important principle users should understand is that any change to a data value or structure can change the geometry of the dataset. Missing-value filling, numeric type conversion, duplicate-column removal, or aggressive standardization can change variance, outlier fences, correlations, VIF, and multivariate outlier diagnostics.
If no values are imputed, no numeric values are changed, no duplicate columns are removed, and no types or roles are converted, these diagnostic counts should generally remain the same. If the counts change, the report should explain why: missing-value imputation may change variance, duplicate-column removal may change correlation and VIF structure, and type conversion may bring previously hidden numeric values into the diagnostic calculation.
This is why Brill-Viz separates cleaning actions from diagnostic flags. Cleaning actions are changes the workflow actually made, such as safe missing-value handling, type correction, duplicate-column removal, or text standardization. Diagnostic flags are warnings about the shape and relationships of the data.
Outliers, VIF, high-correlation pairs, and multivariate outlier signals belong in the report-and-review layer unless the user deliberately takes further action.
This gives users a clearer interpretation of before-and-after summaries. If outlier, VIF, high-correlation, or multivariate outlier counts change after cleaning, the change should be understood as a diagnostic recalculation caused by an allowed transformation, not as evidence that sensitive observations were automatically removed. The Auto-Clean Report should make this distinction visible.
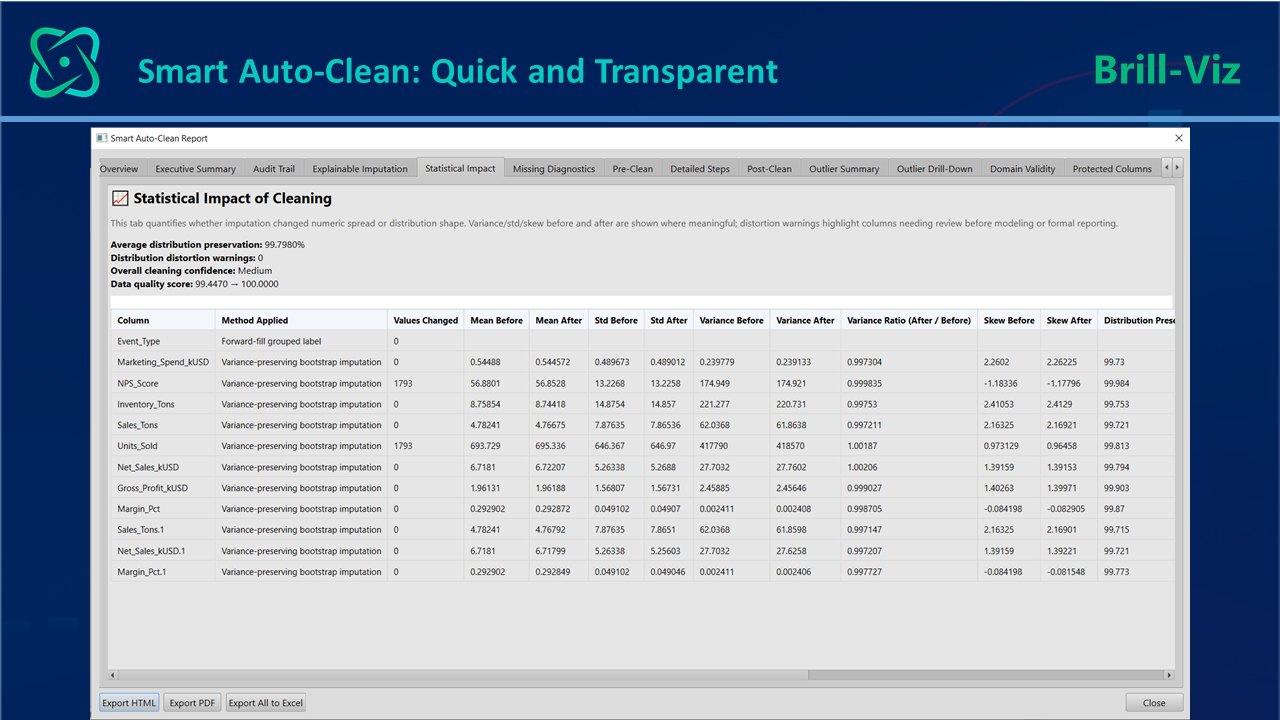
Figure 10: Statistical Impact tab which shows before-and-after variance, standard deviation, skewness, distortion flags, and preservation score.
Use the Auto-Clean Report as an Audit Trail
The Auto-Clean Report is the governance layer of Smart Auto-Clean. It is not just a summary screen. It is a structured report that documents the cleaning process through multiple tabs: Overview, Executive Summary, Explainable Imputation, Statistical Impact, Missing Diagnostics, Pre-Clean, Detailed Steps, Post-Clean, Outlier Summary, Outlier Drill-Down, Domain Validity, Protected Columns, Post-Mortem, Methodology, and Full Report.
This means the user can review the cleaning process at different levels. The Overview gives a quick orientation. The Executive Summary gives management-level interpretation. The Explainable Imputation tab explains how missing values were handled. The Statistical Impact tab shows whether the data changed materially. The Missing Diagnostics tab explains missingness patterns. The Detailed Steps tab gives column-level actions.
The Outlier tabs show what was flagged and where. The Domain Validity tab identifies plausibility issues. The Protected Columns tab explains what was deliberately left untouched. The Methodology tab explains the logic. The Full Report gives a complete audit trail.
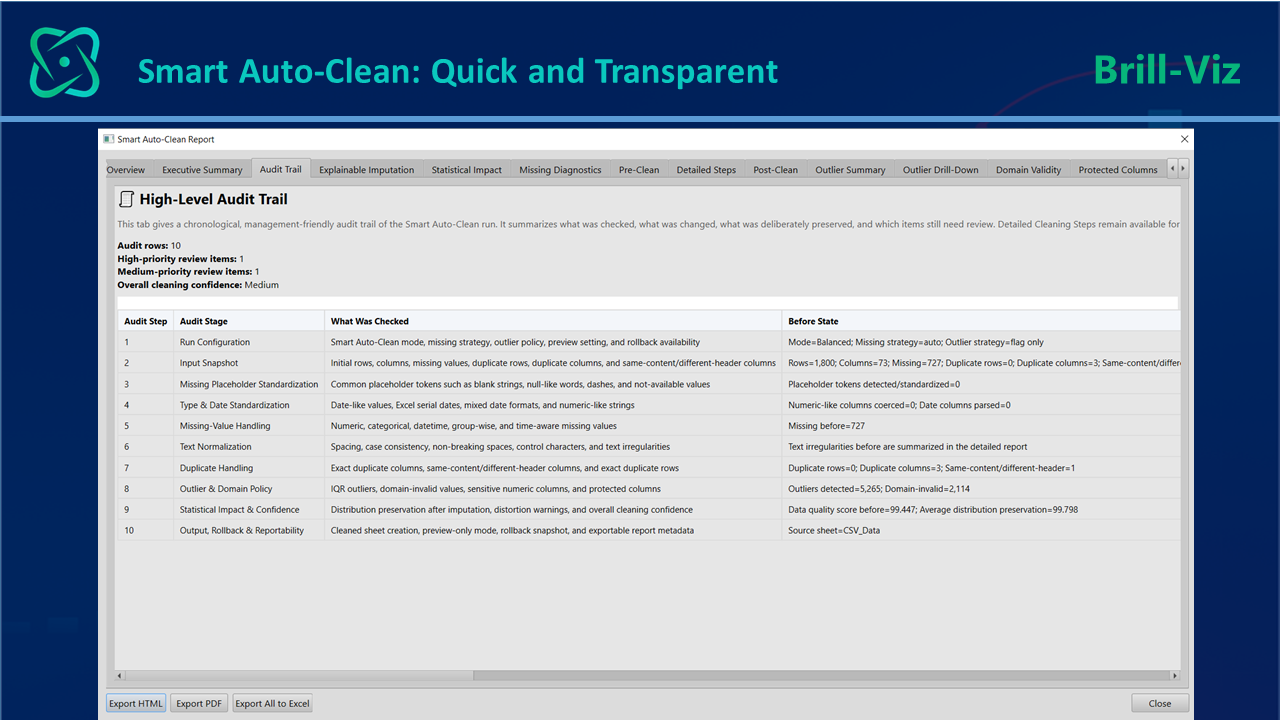
Figure 11: Audit Trail tab summarizes what was checked, what was changed, what was deliberately preserved, and which items still need review.
The complete cleaning report can also be exported to HTML, PDF, and Excel; however, HTML is the best readable format, PDF has some issues in displaying tables but Excel carries several tables generated during the cleaning process.
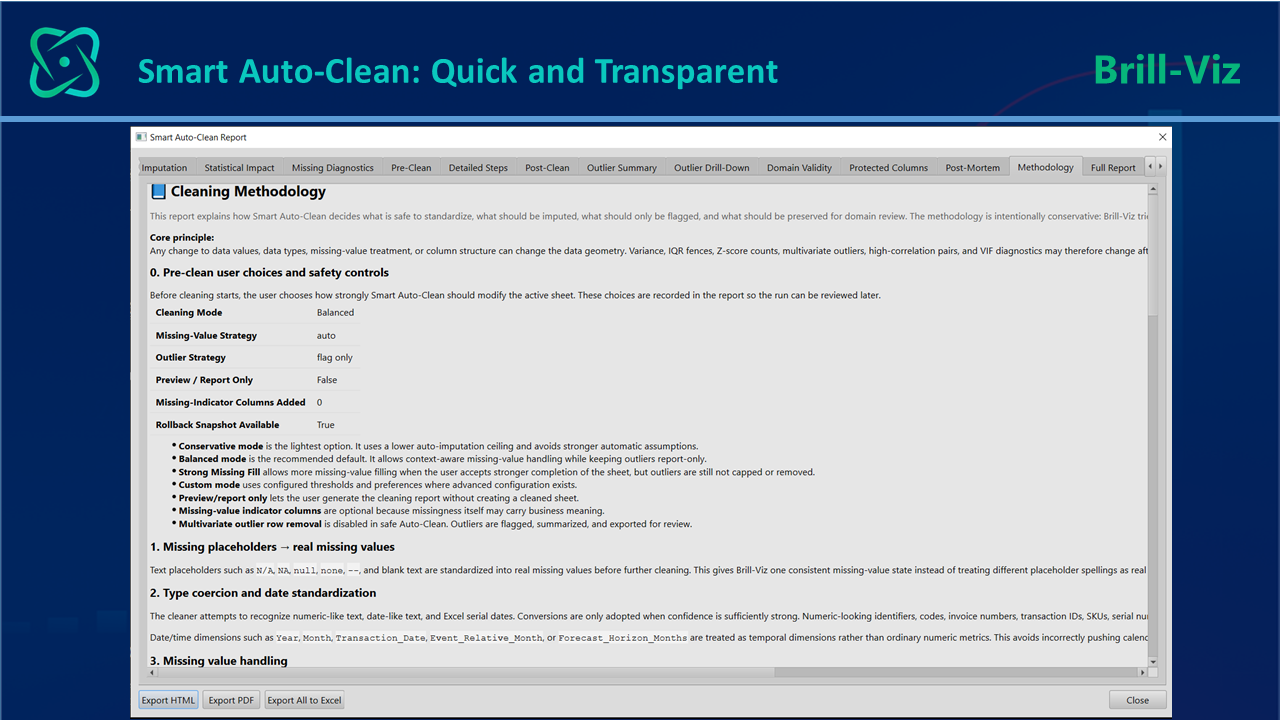
Figure 12: Cleaning Methodology tab shows all the methods and process applied in cleaning the data
This turns Smart Auto-Clean from a hidden preprocessing step into a reviewable and shareable quality-control record.
Stage 5 - Analysis-Ready Data
The final visual stage is Analysis-Ready Data. After loading, issue detection, controlled cleaning, and report review, the user is in a much stronger position to trust the cleaned sheet and carry it forward into snapshots, comparative intelligence, Smart-Stats, forecasting, and other decision-support workflows.
Why This Matters for Modern Business Analytics
Modern analytics does not fail only because users lack charts. It often fails because users cannot fully trust the data behind the charts. Smart Auto-Clean solves this problem by connecting automation with transparency. It reduces manual preparation effort, but it also keeps the user informed.
It can clean obvious issues, diagnose missingness, select safer fill logic, standardize text and dates, detect duplicate structures, flag outliers, check domain plausibility, protect sensitive columns, and report the statistical impact of cleaning.
This creates a stronger foundation for everything that follows in Brill-Viz: executive snapshots, comparative intelligence, Smart-Stats, forecasting, predictive intelligence, prescriptive recommendations, and what-if simulation.
A practical selling message is therefore clear: ordinary spreadsheet cleaning often asks the user to find blanks, choose rules, apply them column by column, and remember what was done. Brill-Viz turns that into a guided, context-aware, report-backed workflow.
The result is not just cleaner data. The result is more defensible analysis. The real value of data cleaning is not simply removing errors. It is reducing decision risk. Every corrected inconsistency, every properly handled missing value, every protected identifier, and every explainable cleaning decision helps ensure that executives are making decisions based on evidence rather than hidden data problems.
In many organizations, that confidence is worth far more than producing another attractive dashboard.
Key Takeaways
Closing Remarks
Smart Auto-Clean represents an important principle in modern analytics: data preparation should be visible, explainable, and reviewable. A cleaned dataset is not enough if the user cannot explain how it was cleaned. A dashboard is not enough if the data behind it was silently changed. A forecast is not enough if missing values, outliers, dates, duplicates, and protected fields were handled without traceability.
Brill-Viz Smart Auto-Clean addresses this gap by combining automated cleaning with user control, context-aware missing-value handling, conservative safety policies, detailed diagnostics, statistical impact checks, and a full Auto-Clean Report. This makes the workflow more than data cleaning. It becomes the first layer of decision intelligence.
interested, you can find a detailed account on transforming raw data into decision intelligence through in-depth analytics of cleaned data.