Important scope note
APA Style provides reporting and presentation guidance, but it does not prescribe one universal statistical test for every design. The appropriate model, post-hoc procedure, effect size, and assumption check still depend on the research question, study design, data structure, and target journal.
For this reason, the safest description is APA 7-aligned publication reporting, not guaranteed acceptance by every journal.
Researchers often spend months designing experiments, collecting observations, checking data quality, and selecting statistical models. Yet after the analysis is complete, another demanding stage begins: turning statistical output into evidence that supervisors, reviewers, editors, and readers can understand quickly and evaluate correctly.
A result can be statistically correct but still not be publication-ready. A table may contain redundant columns. A superscript letter may appear without explanation. A post-hoc method may be named incorrectly. A p-value may be reported without an effect size. A repeated-measures result may ignore sphericity. A chart may show standard errors while the table reports standard deviations. These are not merely cosmetic issues; they affect transparency, interpretation, and scientific credibility.
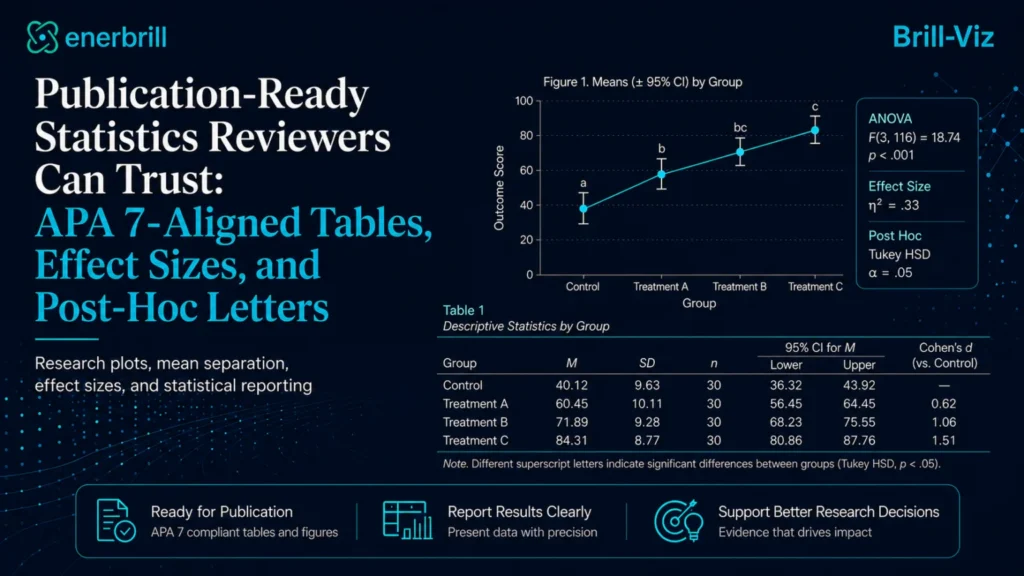
Publication-ready reporting therefore requires a connected workflow in which the fitted model, assumptions, effect sizes, pairwise comparisons, compact letters, tables, notes, charts, and narrative all come from the same analysis.
At a Glance
- Statistical output and publication output serve different purposes; researchers need both a detailed analytical table and a concise manuscript table.
- A p-value answers whether the data are incompatible with a null model, while an effect size helps describe the magnitude of the observed effect.
- Compact-letter displays summarize pairwise decisions, but non-significance is not transitive.
- Assumption checks are part of responsible reporting: Levene’s test informs equal-variance decisions, and repeated-measures ANOVA may require sphericity corrections.
- The table note must name the exact mean-separation method—Tukey HSD, Fisher LSD, Games–Howell, Duncan, or Bonferroni-adjusted comparisons—and state the significance level.
- Research-ready plots and APA-oriented tables should be generated from the same statistical result so that values, uncertainty measures, letters, and methods remain consistent.
Why Statistical Output Is Not Automatically Publication-Ready
Most statistical programs are designed to expose analytical detail. Their output may contain sample size, mean, standard deviation, standard error, variance, confidence intervals, test statistics, p-values, effect sizes, pairwise comparisons, diagnostics, and model coefficients. Those details are useful during analysis, but placing all of them in one manuscript table can make the central result difficult to see.
A publication table should answer a focused question: What was compared, what summary was reported, how uncertain or variable were the estimates, and which comparisons were statistically distinguishable? Supporting detail should remain available in a secondary table, model summary, supplementary file, or export—not be discarded.
SD, SEM, and confidence intervals are not interchangeable
- Standard deviation (SD) describes variability among the observed values.
- Standard error of the mean (SEM) describes the precision of the estimated mean.
- A confidence interval (CI) provides a range of plausible values for the population parameter and communicates precision more directly.
A journal may prefer Mean ± SD, Mean ± SEM, or a mean with a 95% CI. The important rule is to choose a measure that matches the scientific purpose, label it clearly, and use the same measure in the table, chart, caption, and note.
Detailed Statistical Table
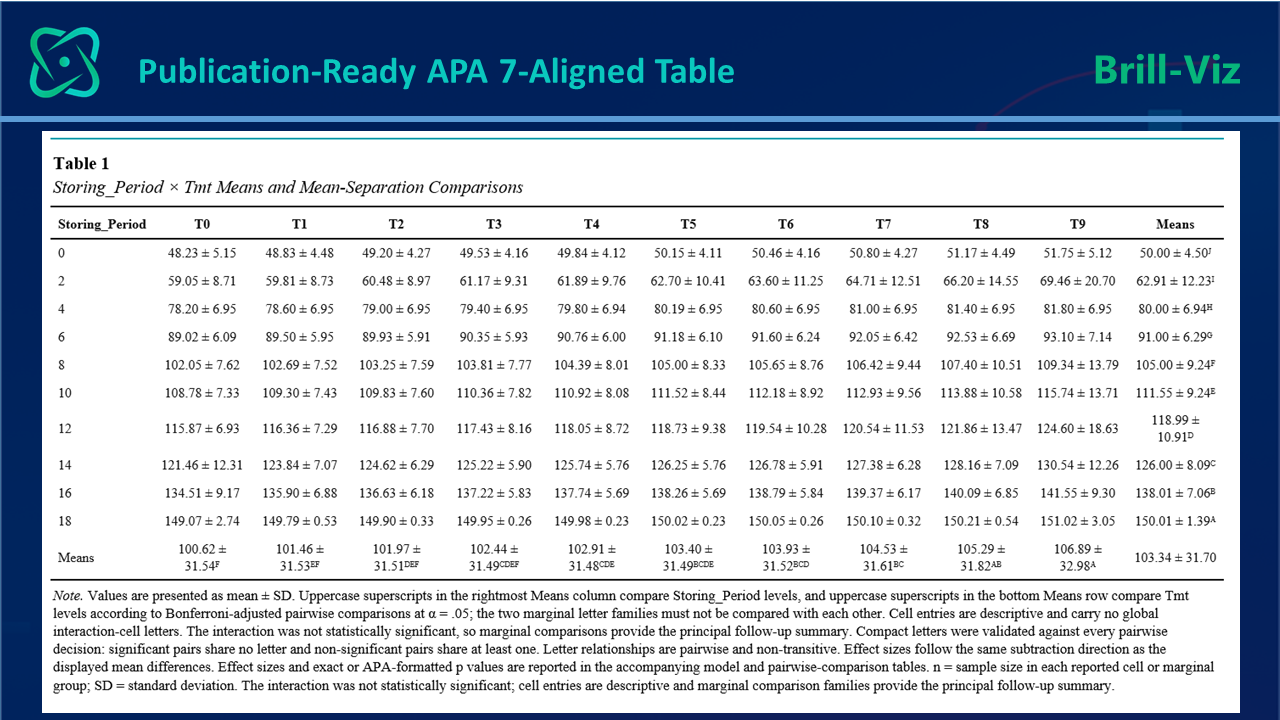
The detailed table supports validation, supervisor review, audit, and supplementary reporting. It may retain n, Mean, SD, SEM, variance, confidence intervals, raw and adjusted p-values, effect sizes, compact letters, and diagnostic information.
The detailed table supports validation, supervisor review, audit, and supplementary reporting. It may retain n, Mean, SD, SEM, variance, confidence intervals, raw and adjusted p-values, effect sizes, compact letters, and diagnostic information.
Figure 1. Illustrative APA 7-aligned table output from Brill-Viz Grouped Stats. Exact content depends on the selected design, effect-size convention, and mean-separation method
The Teaching Point Hidden Inside Compact Letters
Compact-letter displays are popular because they summarize many pairwise comparisons in a small space. Groups sharing at least one letter are not significantly different under the selected comparison procedure; groups with no shared letter are significantly different at the stated alpha level.
However, the example above reveals a crucial principle that is often missed: non-significance is not transitive. A and B share the letter a, so A and B are not significantly different. B and C share the letter b, so B and C are not significantly different. Yet A and C share no letter, so A and C are significantly different.
Do not treat letters as equivalence classes
“A is not different from B” and “B is not different from C” do not imply that “A is not different from C”. Compact letters encode individual pairwise decisions, not a transitive hierarchy of scientifically identical groups.
This is why the table note should explain the shared-letter rule and why the detailed pairwise table should remain available for review.
A p-Value Is Not Enough: Report Effect Size
A p-value helps assess whether an observed result is difficult to reconcile with a specified null model. It does not, by itself, tell readers whether the effect is small, moderate, large, or practically important. APA quantitative reporting standards emphasize effect sizes alongside confidence intervals or statistical significance information.
A publication-ready workflow should, therefore, report both statistical evidence and magnitude. The most appropriate effect size depends on the design.
- One-way ANOVA: η² and, where useful, the less biased ω².
- Two-way ANOVA, RCBD, and ANCOVA: partial η² for each modeled effect, clearly labeled.
- Repeated measures: partial η² or generalized η², with the chosen definition stated.
- Independent pairwise comparisons: Cohen’s d or the small-sample bias-corrected Hedges’ g, preferably with a confidence interval.
- Paired comparisons: a paired standardized effect such as dᶻ or its bias-corrected equivalent.
- Mixed models: fixed-effect estimates with confidence intervals, variance components, and suitable model-level R² measures rather than forcing one ANOVA effect-size convention onto every model.
The concise means table does not need to become crowded with every effect size. Effect sizes can appear in the ANOVA/model table, the detailed comparison table, and the written Results statement while the main publication table remains readable.
A copy-ready APA-style results sentence
A one-way ANOVA showed a statistically significant treatment effect, F(2, 69) = 14.32, p < .001, η² = 0.29
This single sentence communicates the model, degrees of freedom, test statistic, significance, and effect magnitude. Similar sentences can be generated for each main effect and interaction in a factorial design.
Name the Exact Mean-Separation Method
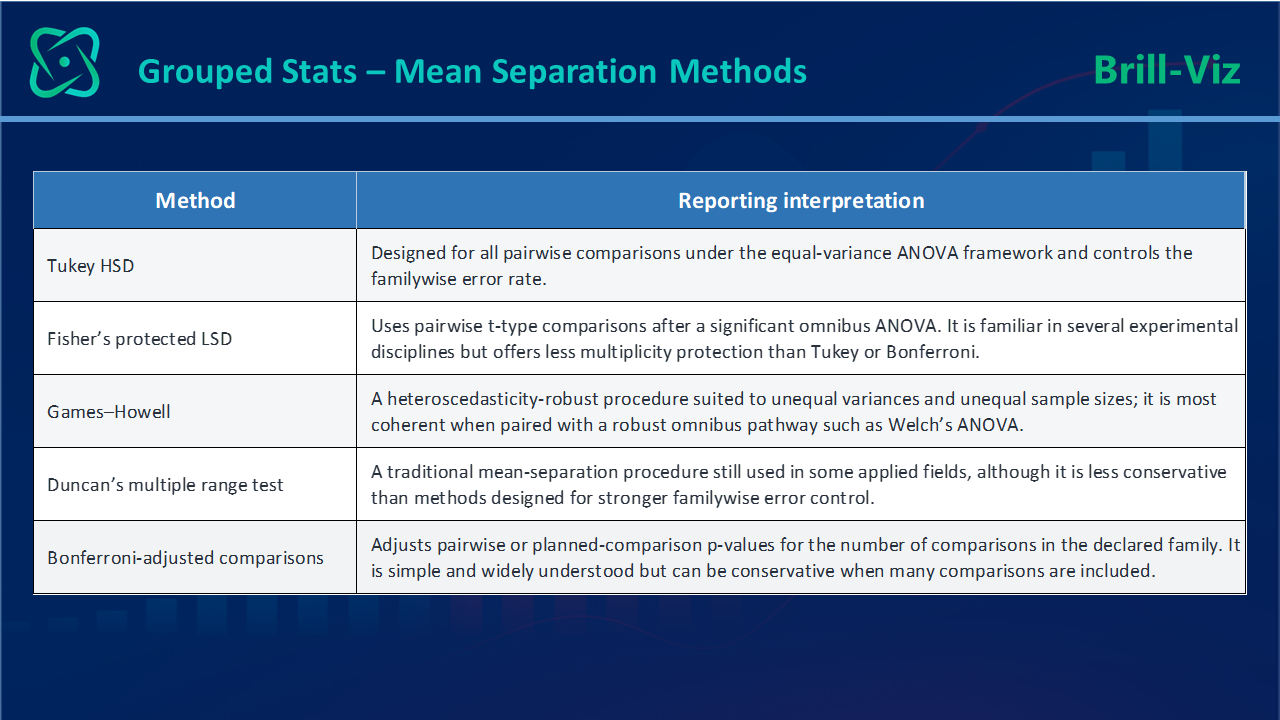
After an omnibus test, researchers may need planned contrasts or post-hoc pairwise comparisons. The method must be stated because different procedures control error rates differently and rely on different assumptions.
Figure 2. Mean-separation methods
Bonferroni should be described as an adjustment applied to a defined family of comparisons, not as a universal replacement for every post-hoc method. In a two-way design, the family may consist of comparisons within one factor level, simple effects, or a set of prespecified marginal contrasts. The family must be defined so that the adjusted p-values and compact letters are interpretable.
Method-aware notes
The note must update automatically when the selected method changes. For example:
Note. Values are means ± SD. Means sharing at least one superscript letter are not significantly different based on Bonferroni-adjusted pairwise comparisons at α = 0.05. n = sample size per treatment; SD = standard deviation.
If Tukey HSD, Games–Howell, Duncan, or Fisher LSD is selected, the note should name that method instead. LSD critical differences should be shown only for LSD, not relabeled for other procedures.
Assumption Checks Are Part of Publication-Ready Reporting
Assumption checks should not be treated as a hidden preliminary step. They influence which model, correction, or comparison procedure is appropriate and should be summarized transparently.
Homogeneity of variance and Levene’s test
Standard independent-groups ANOVA assumes that group variances are sufficiently comparable. Levene’s test evaluates evidence against the equality-of-variance assumption and is less sensitive to non-normality than Bartlett’s test.
- If Levene’s test is not statistically significant, the equal-variance framework may remain reasonable, subject to the broader diagnostics and design.
- If Levene’s test is significant, the output should warn the user that homogeneity may be violated.
- For independent groups, a coherent robust route is Welch’s omnibus ANOVA followed by Games–Howell comparisons rather than attaching Games–Howell letters to an unexamined equal-variance result.
Sphericity in repeated-measures ANOVA
Repeated-measures ANOVA has an additional assumption: sphericity. In practical terms, sphericity concerns the equality of the variances of pairwise difference scores across repeated conditions. With only two repeated levels, sphericity is automatically satisfied and no test is needed.
With three or more repeated levels, a publication-ready workflow should report Mauchly’s test and provide Greenhouse–Geisser and Huynh–Feldt corrections when the assumption is violated. These corrections modify the degrees of freedom of the F test, which changes the p-value without changing the observed F ratio.
- Report whether Mauchly’s test indicated a violation.
- Show epsilon values for Greenhouse–Geisser and Huynh–Feldt.
- Use the corrected degrees of freedom and p-value in the Results narrative when required.
- State explicitly which correction was used.
- Preserve within-subject pairing in post-hoc comparisons and apply the selected multiplicity adjustment to paired contrasts.
One-Way and Two-Way Publication Tables Tell Different Stories
A one-way ANOVA compares levels of one factor, such as treatment. A two-way ANOVA evaluates two main effects and their interaction. For example, a storage study may assess treatment, storage interval, and treatment × storage interval.
When an interaction is statistically significant, the pattern of treatment differences may change across intervals. A publication matrix can therefore show Mean ± SD for each treatment × interval cell, plus marginal means when they are scientifically meaningful.
- Lowercase superscripts can identify differences among treatment × interval cells.
- Uppercase superscripts can identify treatment or interval marginal-mean comparisons.
- The note must define which letter system applies to which comparison family.
- The ANOVA table should report both main effects, the interaction, residual error, effect sizes, and exact or threshold-formatted p-values.
Interpret the interaction before isolated main effects
A statistically significant interaction may make a simple statement such as “Treatment A was better than Treatment B” incomplete. The answer may depend on the storage interval, time point, dose, location, or other factor.
Publication Reporting Beyond Standard ANOVA
Randomized complete block design (RCBD)
Blocking is used to control known nuisance variation and improve the precision of treatment comparisons. Treatment is normally the primary scientific effect of interest. The block effect appears in the model because it absorbs systematic variability, but it should not automatically receive the same interpretive emphasis as treatment.
A fixed-effects RCBD should be described as block-adjusted. If blocks are conceptualized as a random sample from a wider population of blocks, a mixed model is more appropriate and should report the block variance component rather than treating block as an ordinary treatment-like factor.
ANCOVA
ANCOVA adjusts group comparisons for one or more covariates. Publication tables should generally report adjusted or estimated marginal means, with the covariate and adjustment clearly stated. Pairwise effects and confidence intervals should be derived from the fitted model rather than calculated from raw group means alone.
Mixed models
Mixed models combine fixed effects with random effects and can accommodate clustered, blocked, longitudinal, or otherwise dependent data. A publication-ready mixed-model report should identify the random-effects structure, covariance assumptions, fixed-effect estimates, confidence intervals, variance components, and model-based estimated marginal means where used.
APA-Oriented Table and Number Formatting
APA-style tables prioritize clarity over decoration. The basic structure includes a bold table number, an italicized title on the next line, clear headings, and a general note beneath the table when clarification is needed.
- Avoid vertical lines and decorative cell grids in the manuscript table.
- Use only the horizontal rules needed to separate the header and the body.
- Avoid shaded headers in the APA manuscript version, even if shading remains useful inside the application interface.
- Use consistent decimal precision for comparable statistics.
- Report exact p-values when practical; use p < .001 rather than p = .000.
- Define abbreviations such as SD, SEM, CI, and EMM in the note.
- Use true superscripts for compact letters in Word and PDF exports.
- Choose one significance-communication system in a table—letters, symbols, or explicit p-values—and explain it consistently.
Why Charts and Tables Must Come from the Same Result
Research plots are part of the evidence, not decorative attachments. Inconsistency arises when the chart and table are built separately: the chart may show SEM while the table reports SD; the table may use adjusted means while the chart plots raw means; or the letters may come from Tukey HSD while the note names Fisher LSD.
A defensible workflow uses one statistical result object as the source for the chart, publication table, detailed table, pairwise comparisons, effect sizes, assumptions, Results narrative, and exports. This improves reproducibility and reduces transcription errors.
A Practical Publication-Ready Workflow
- Identify the experimental design and dependence structure before selecting a test.
- Fit the appropriate one-way, factorial, blocked, covariate-adjusted, repeated-measures, or mixed model.
- Evaluate assumptions and diagnostics relevant to that model.
- Select a justified comparison procedure and define the comparison family.
- Calculate effect sizes and confidence intervals alongside p-values.
- Generate compact letters from the same adjusted pairwise decision matrix.
- Create a concise APA-oriented table and retain a detailed analytical table.
- Generate the chart, table note, model summary, and Results statement from the same results.
- Review the target journal’s instructions before submission.
How Brill-Viz Supports the Workflow
Brill-Viz Grouped Stats is designed to connect grouped statistical analysis, research visualization, interpretation, and publication reporting without forcing users to rebuild the same result across several applications.
Depending on the design, users can work with publication-oriented one-way ANOVA, two-way ANOVA, RCBD, ANCOVA, repeated-measures analysis, mixed models, and research-batch workflows. The output can retain both a concise publication table and the detailed statistical evidence needed for review.
Mean-separation methods available in one workflow
- Tukey HSD
- Fisher’s protected LSD
- Games–Howell
- Duncan’s multiple range test
- Bonferroni-adjusted comparisons
The selected method is carried into the letters, detailed pairwise table, automatic note, Methods text, Results narrative, and publication exports. This prevents a common reporting failure: calculating with one procedure while naming another.
Effect sizes and copy-ready Results statements
Brill-Viz can report ANOVA effect sizes such as η², ω², and partial η², as appropriate to the design, and standardized pairwise effects such as bias-corrected Hedges’ g. It can also prepare copy-ready statistical sentences containing F, degrees of freedom, p, and effect size.
Assumption-aware reporting
Levene’s test and robust-method guidance help users recognize when the equal-variance pathway may be questionable. Repeated-measures workflows can report Mauchly’s test and Greenhouse–Geisser or Huynh–Feldt corrections when sphericity is violated.
Two tables without rerunning the analysis
The concise APA-oriented table appears directly in the Tables tab, followed by detailed statistics, ANOVA/model tests, effect sizes, diagnostics, and pairwise comparisons. The same results can be exported to Excel, Word, and PDF, allowing users to move from supervisor review to manuscript preparation without repeating the model.
No formula, no code, no manual lettering
Brill-Viz does not replace research judgment. Researchers still need to choose a defensible model, understand assumptions, interpret interactions, and follow the target journal’s requirements. Its role is to reduce repetitive technical work: no manual formulas, no coding of compact-letter algorithms, no copying values between multiple tables, and no rewriting the footnote every time the comparison method changes.
Why Brill-Viz, but Not Existing Research & Analytical Tools?
There exists several extremely powerful research and analytical tools, which can automate advanced models, estimated marginal means, compact-letter displays (CLD), and fully reproducible reports when researchers build or adopt a suitable coding and reporting pipeline, also providing accessible graphical interfaces, established statistical procedures, and export options.
Brill-Viz is not based on the claim that those existing tools are weak by any means. They are all very sophisticated and powerful. But, the practical difference is workflow integration. Researchers often complete the statistical test in one environment and then reconcile adjusted means, effect sizes, assumption checks, compact letters, chart error bars, table notes, and Word or Excel formatting through several additional steps. The risk is not only lost time; it is inconsistency between the model, chart, letters, note, and final manuscript table.
Brill-Viz is designed for researchers who want a coordinated, no-formula, no-code, and no-prompt route from grouped analysis to research plots, APA 7-aligned tables, automatic notes, copy-ready Results text, and Word, PDF, or Excel exports, without manually reconstructing the same result after every method change.
The differentiator between Brill-Viz and other statistical analysis and research reporting tools is, therefore, not “statistics versus statistics”; It is an integrated publication workflow that keeps the statistical evidence and its presentation synchronized while remaining accessible to users who do not want to program or maintain a custom reporting stack.
What “APA 7-Aligned” Really Means
An application can align its table structure, statistical notation, p-value formatting, effect-size reporting, notes, and exports with APA 7 guidance. It cannot guarantee that every journal will accept every table unchanged. Journals may impose discipline-specific conventions, word limits, preferred effect sizes, required confidence intervals, or alternative table layouts.
The responsible claim is therefore that Brill-Viz supports APA 7-aligned publication reporting and provides the statistical context needed for transparent research communication. Final responsibility remains with the researcher and the journal’s author instructions.
Key Takeaways
- Publication-ready reporting connects the model, assumptions, effect sizes, pairwise comparisons, compact letters, chart, table note, and Results narrative.
- A concise manuscript table and a detailed analytical table should be retained from the same fitted model rather than reconstructed separately.
- Superscript letters summarize pairwise decisions; shared-letter relationships are not transitive and do not create groups of statistically identical treatments.
- The selected comparison procedure and comparison family must be stated, and robust or corrected pathways should be used when assumptions require them.
- Brill-Viz focuses on integrated, APA 7-aligned reporting without replacing research judgment or the target journal’s author instructions.
Closing Remarks
Publication readiness is not a decorative stage added after the “real” statistics. It is the point where the model, assumptions, magnitude, uncertainty, comparisons, and scientific interpretation are brought together for scrutiny.A good table does more than display numbers. It tells readers what was summarized, how groups were compared, what the letters mean, how large the effect was, and whether the assumptions affected the analysis. A good chart visualizes that same result rather than telling a parallel story.
By preserving detailed evidence while producing concise APA-oriented tables, Brill-Viz helps researchers move from statistical calculation to research communication—without repeatedly reconstructing the analysis, writing formulas, coding comparison logic, or manually assigning letters.
From analysis to effect size, from assumptions to letters, and from plots to publication tables, the goal is evidence that is easier to review, trust, and communicate.
FAQs